Is the CPU usage of Windows going up after a long time of not using the system or after installing updates? That may be due to the Google Chrome Software Reporter Tool. Here is some information. First of all: I can not test very much at the moment, because I am sitting in the digital no-man’s-land for a few hours with a shaky internet connection and a small netbook. But I have a few minutes to write an observation. It may be that I am wrong. At least it would be an idea for other sufferers to take a look.
Why is?
After unmasking Meltdown and Specter attack methods on CPUs, Microsoft began frantically rolling out emergency updates in January 2018 and also preferred patchday updates a week earlier (see, for example, Critical Security Updates for Windows 7 / 8.1 / Server (3./4.1. 2018) ). At the same time it was announced that the meltdown patches will cause line losses.
In the comments here in the blog information is found that the systems are much slower or there was collateral damage. Currently I am sitting on a Medion Akoya 1210 netbook (already a few years old) with Windows 7. When I started this morning, the CPU utilization was 100 percent for minutes, and there was hardly anything to use.
Inspection in Task Manager
So I started looking for which processes generate the load. Short called the Task Manager under Windows 7. But there was not much to see – some Chrome processes for open browser tabs dropped some performance (30%), but nothing that would explain the 100%.
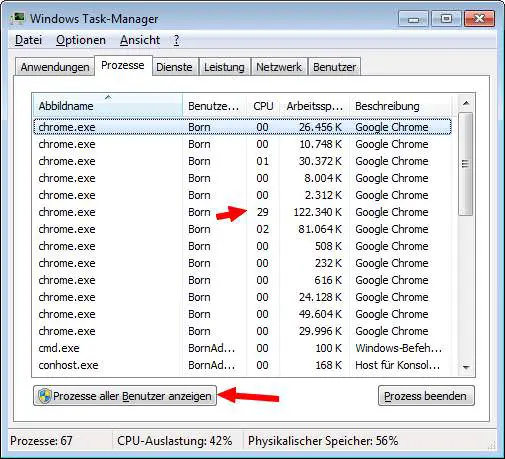
So I decided to look at the processes of all users. Click the Show Processes of All Users button and confirm User Account Control.
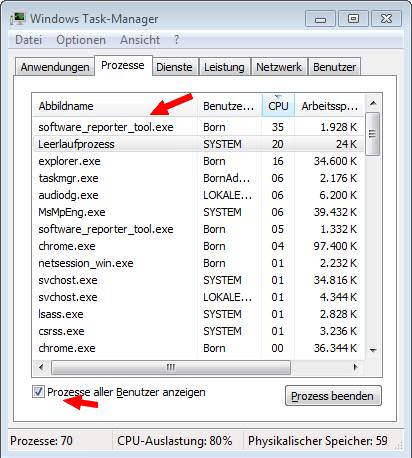
In the screenshot above can be seen, then the Show processes of all users check box is selected. If you then click on the column header CPU of the Processes tab, all processes are listed according to their CPU performance.
There I noticed that three times a process software_reporter_tool.exe occurred. And one of these processes permanently consumed up to 36% power.
In the above screenshot, which I made only later, there are only two processes. And right now, after starting software_reporter_tool.exe , the system also runs well, because the CPU performance of the task immediately drops and the process terminates.
Ad hoc I did not know what this process belongs to. So right click on the entry for the line and the context menu command Open file path selected. And it was already clear what the process belongs to.
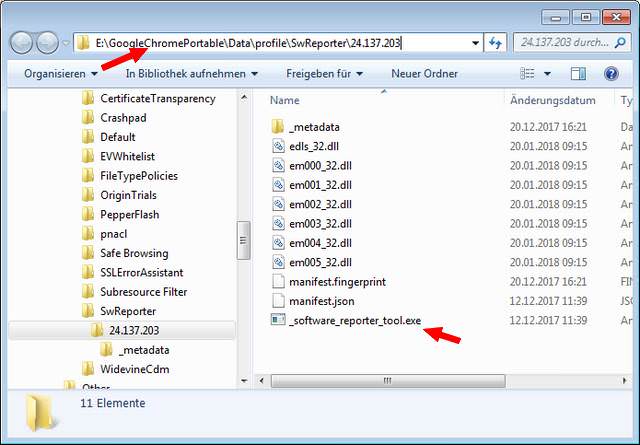
The folder with the Software Reporter Tool belongs to Google Chrome, which I run as a portable version on my system. So in the Windows Task Manager I let the process structure of an instance of software_reporter_tool.exe be terminated via context menu. Thereupon all three process entries disappeared from the task manager and the CPU utilization dropped to 11%.
The Software Reporter Tool is a Google Chrome program that scans the device. The scan is usually started once a week and takes about 20 minutes. This executable is designed to help find programs that may not work well with Chrome, and then remove them. In addition, the application reports these scans to Chrome. This allows the browser to prompt the user to remove the unwanted applications through the Chrome Cleanup Tool.
With this knowledge, the performance degradation can be explained. The netbook is often switched off for weeks. And I’m probably not the only one who noticed the CPU load. But the above guide can be used by any user plagued by performance degradation to see where the CPU’s performance is being retrieved.
I’ve renamed the file software_reporter_tool.exe in the folder to prevent the call. You can probably delete the file, but should note that the part comes back with every Chrome update.


